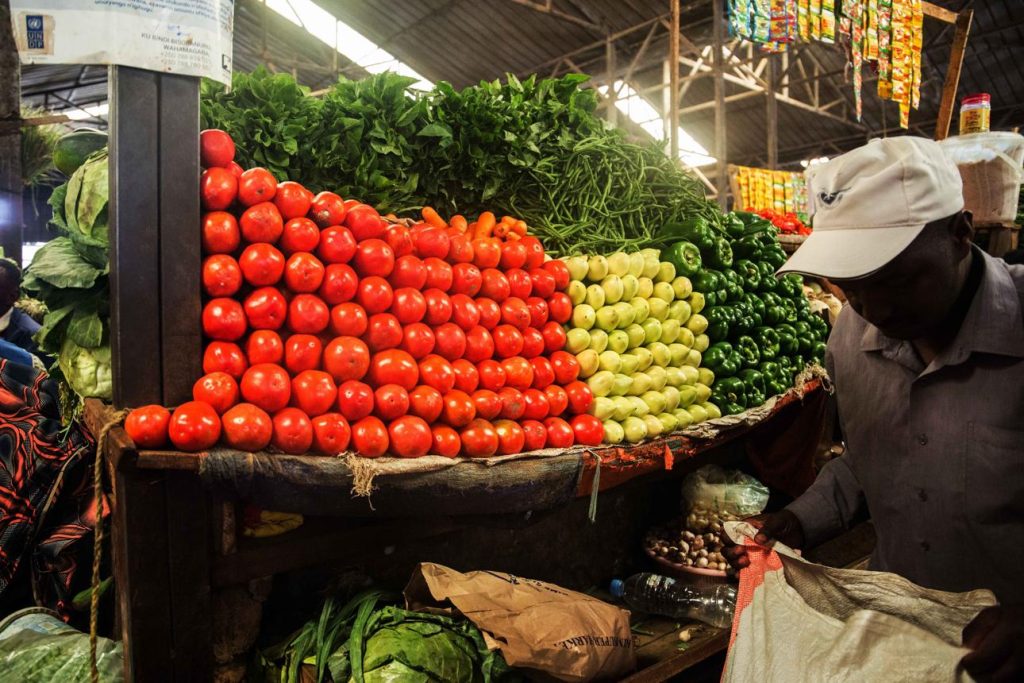
Rwanda’s annual inflation rate rose to 26.5% in October 2026, up from 20% in September, as higher food prices continued to drive the cost of living, according to the National Institute of Statistics of Rwanda (NISR).
The latest Consumer Price Index (CPI) report, released on November 10, shows that prices across the country increased by 6.5% between September and October.
In urban areas, the headline CPI rose by 19.5% year on year and 3.3% month on month. The annual average inflation rate for the period ending October 2026 stood at 12.5%.
The pressure was greater in rural areas, where prices increased by 31.3% annually and 8.6% compared with September.
Food prices lead the increase
Food and non-alcoholic beverages were the biggest contributor to rising urban prices, increasing by 28.9% over the year and 7.8% in one month.
Vegetable prices recorded one of the sharpest increases, rising by 56.4% year on year and 16.5% between September and October. Milk, cheese and eggs increased by 18.6% annually, while meat prices rose by 19.8% despite falling by 9.3% during the month.
Other significant annual increases included transport costs, up 22.4%; restaurants and hotels, up 20.6%; and housing, water, electricity, gas and other fuels, up 14.2%.
Rural households face greater price pressure
The rural CPI recorded a higher annual increase than the urban index, with food and non-alcoholic beverages rising by 43.5% over the year.
Vegetable prices in rural areas increased by 65.7% annually and 18.5% in October alone. Food carries a larger weight in the rural consumer basket, accounting for 48% of the index, compared with 27% in urban areas.
Across Rwanda, food and non-alcoholic beverages rose by 39.1% year on year, while housing-related costs increased by 17.4% and transport by 25.9%.
Local products record faster price increases
NISR’s selected urban indices also show that locally produced goods increased by 22.8% annually, compared with 9.5% for imported goods.
Fresh products recorded a 39.9% annual increase, while the energy index rose by 36.3%. Underlying inflation, which excludes fresh products and energy, increased by 11.5% year on year.
The CPI measures changes in the prices of goods and services purchased by households. NISR collects prices from markets, shops, hospitals and schools, among other locations, covering 1,622 products in its consumer basket.
The October figures highlight the continued pressure on household budgets, particularly from food and other essential expenses.